Market News
Stock market today: NIFTY sectoral indices trading near crucial support; check key technical levels

6 min read | Updated on April 08, 2025, 15:55 IST


SUMMARY
There were no signs of recovery until February, but March brought a ray of hope. However, April erased all the optimism built in March within just five trading sessions. Still, most indices are hovering around the support levels from previous months. Let’s analyse the charts to identify potential support zones or resistance levels for the upcoming sessions.

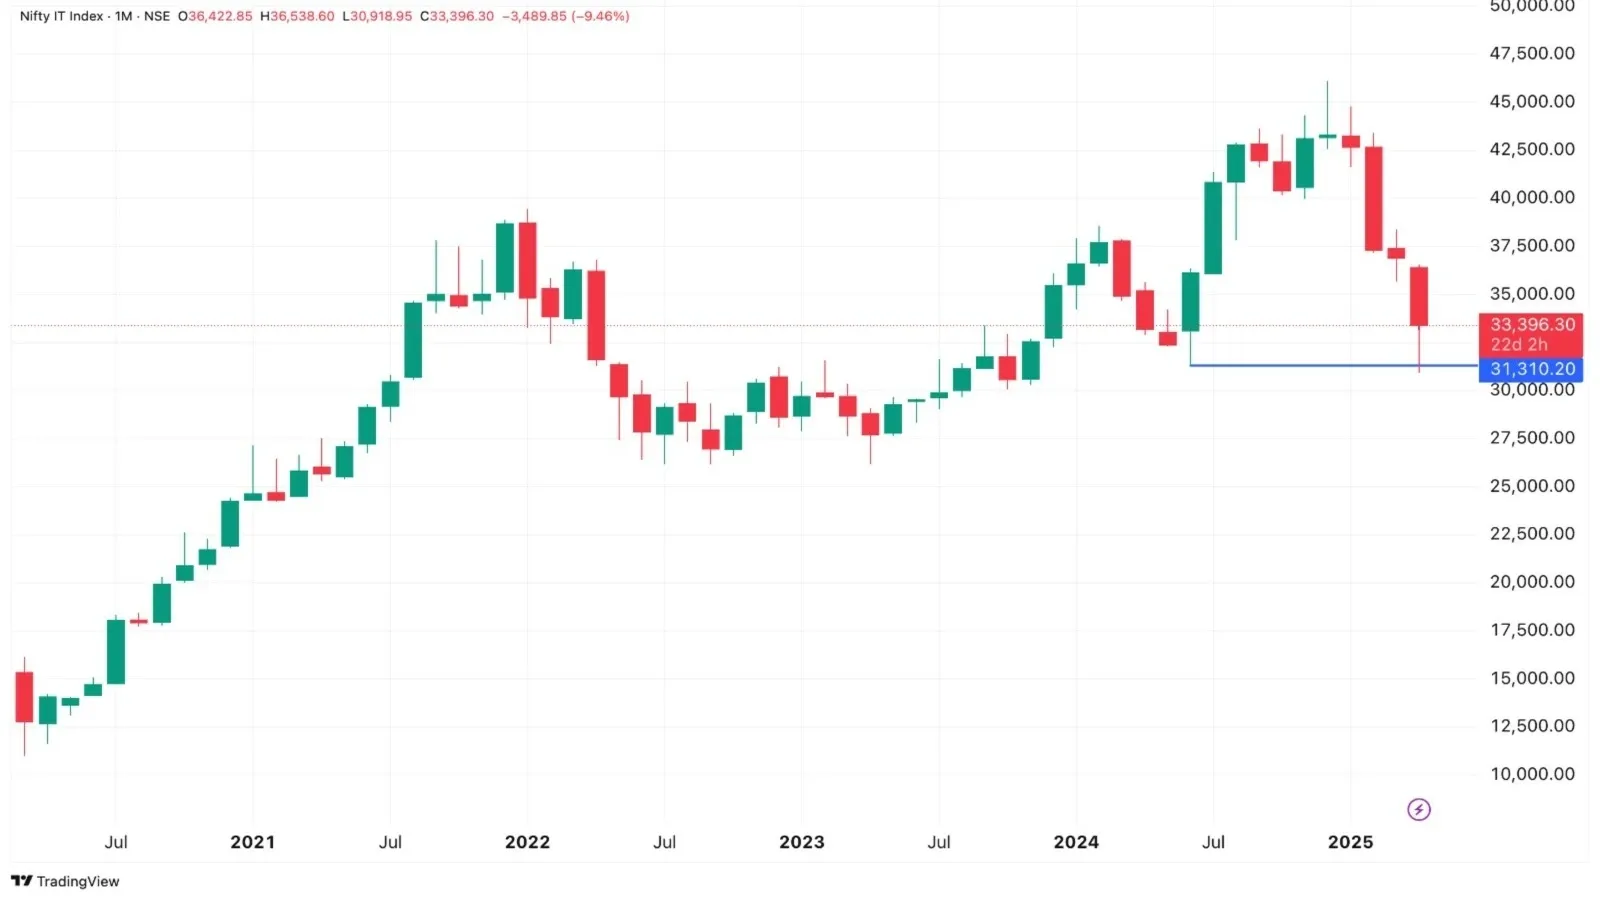
NIFTY IT index has seen a decline in last three months. | Image: Shutterstock
There’s quite a noise around, isn’t there? Yes, I’m referring to the Trump tariffs and the widespread fear triggered globally. This worry is clearly reflected in the Indian stock markets too. Not only the benchmark NIFTY50 but also most sectoral indices have experienced a sharp decline within the first five trading days of April 2025, following the actual implementation of Trump’s tariffs. The NIFTY50, which had recovered in March following a decline in February, gave up all of March’s gains in April and is now trading near lows once again.
NIFTY 50 chart:
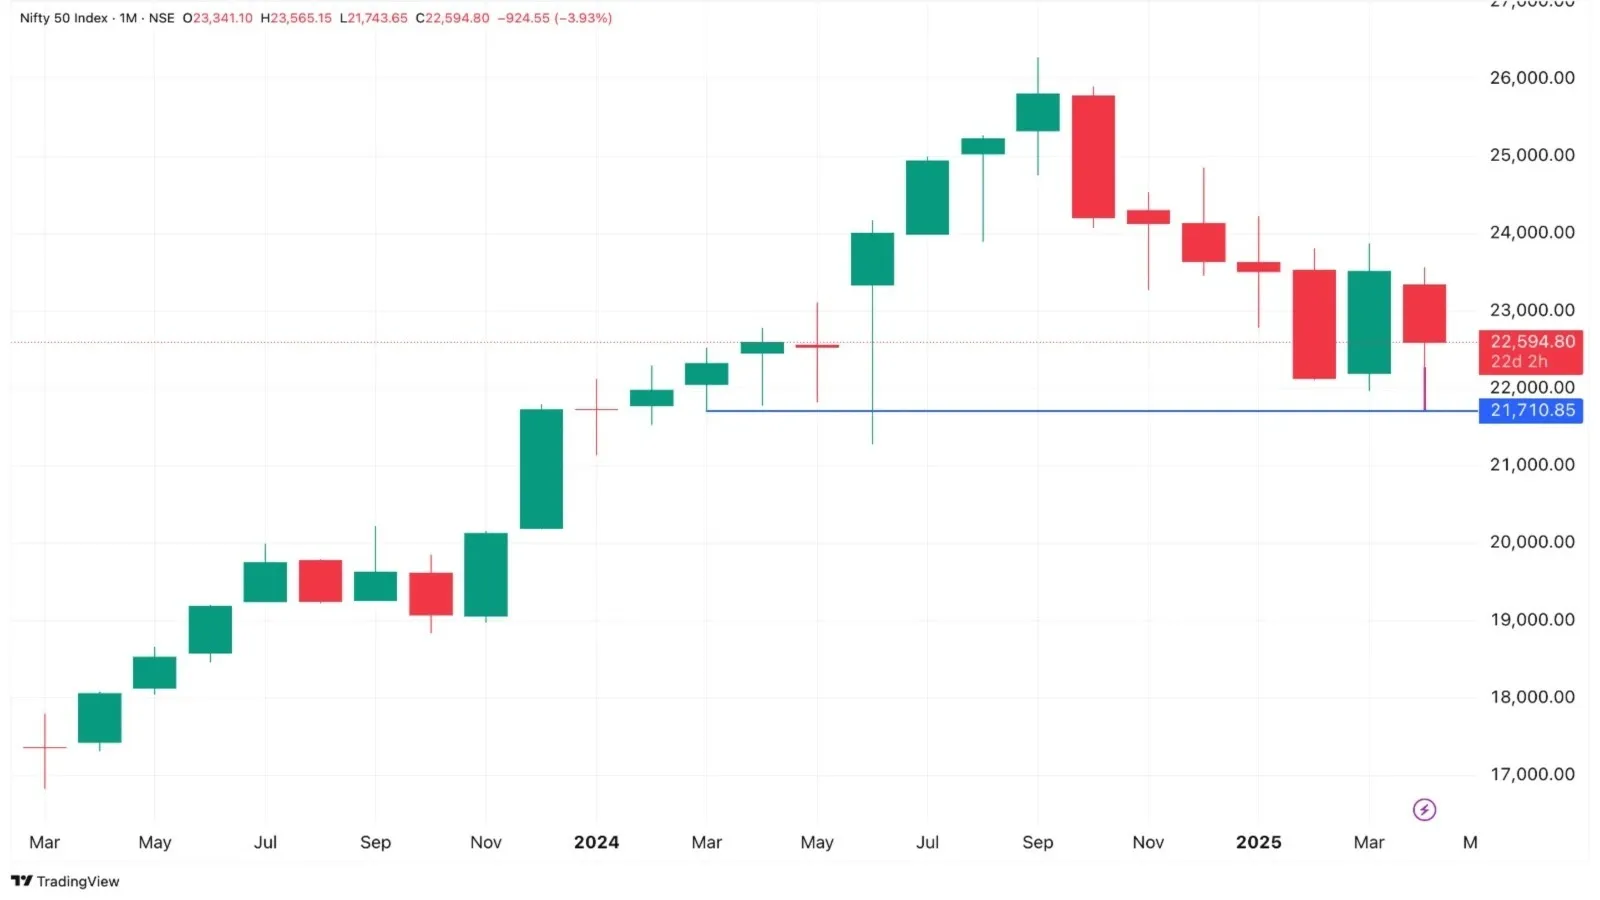
The monthly chart of the NIFTY50 reveals that it recently gave-up all gains from March 2025 and is now lingering near the lows of February and March. If April’s decline pushes significantly below the 21,900–22,100 range, it would indicate further weakness. Conversely, if the index finds repeated support in this zone and rebounds, it might indicate a provisional bottom, showing a way for a potential recovery. Patience will be crucial, as only time will reveal the outcome. Notably, in 2024, the NIFTY50 held similar levels between March and June, forming a consolidation phase before launching into an upward rally from June to September.
| INDEX | Feb (%) | Mar (%) | MTD April (%) |
|---|---|---|---|
| NIFTY50 | -5.9 | 6.3 | -7.0 |
| NIFTY Bank | -2.5 | 6.7 | -4.5 |
| NIFTY Finserv | -0.8 | 8.9 | -5.8 |
| NIFTY Auto | -10.4 | 3.9 | -8.1 |
| NIFTY IT | -12.5 | -1.2 | -13.7 |
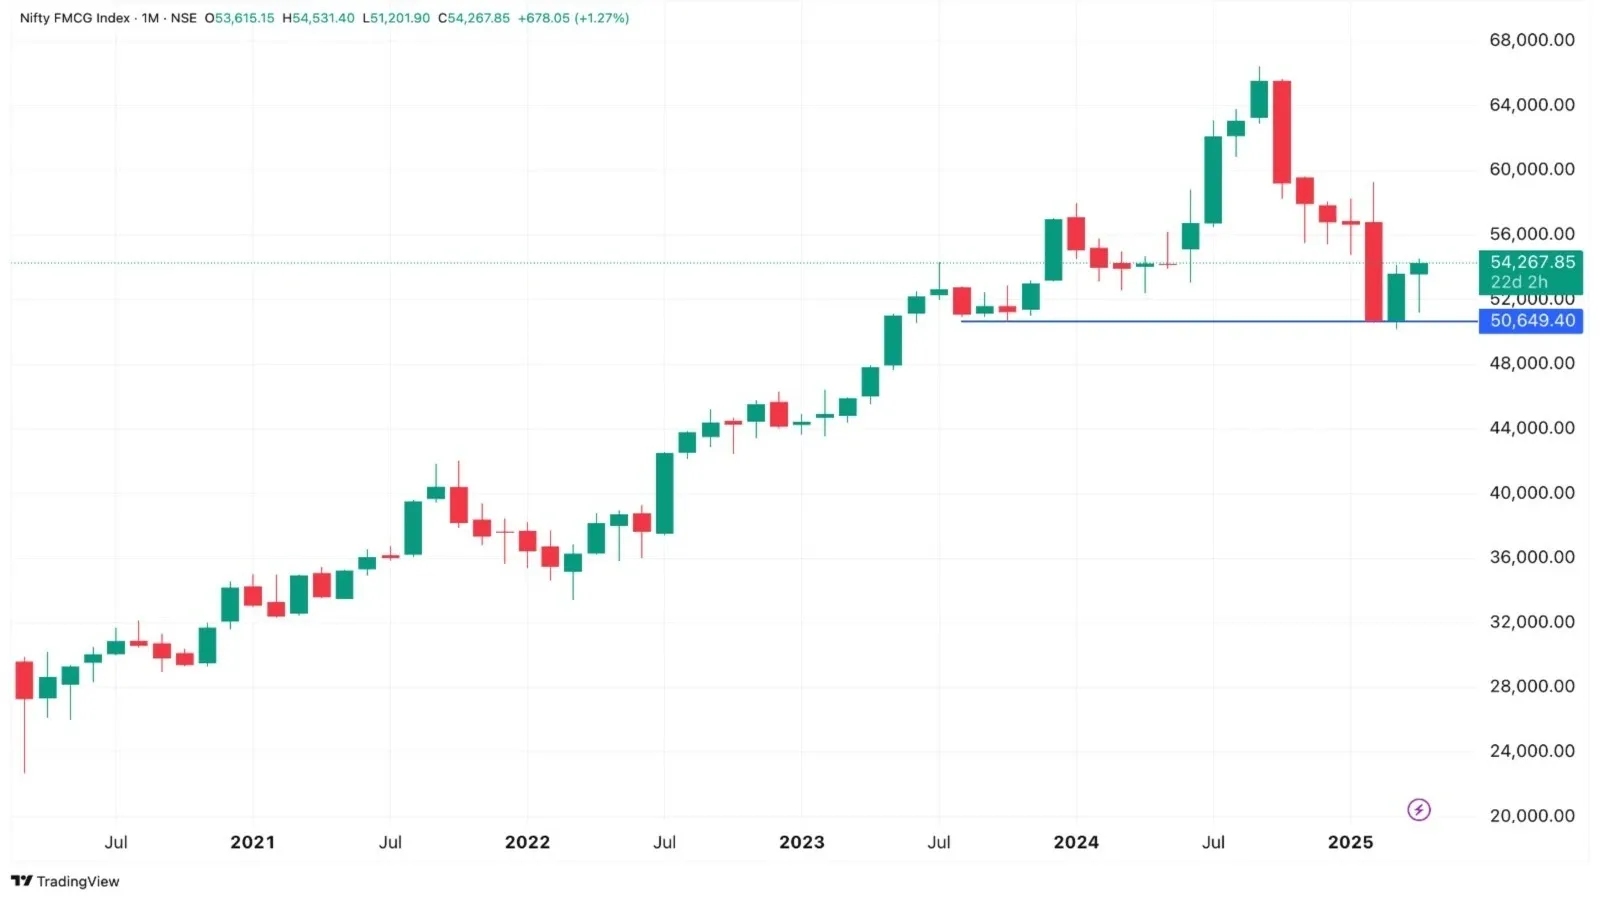
| NIFTY FMCG | -10.6 | 5.7 | -1.7 |
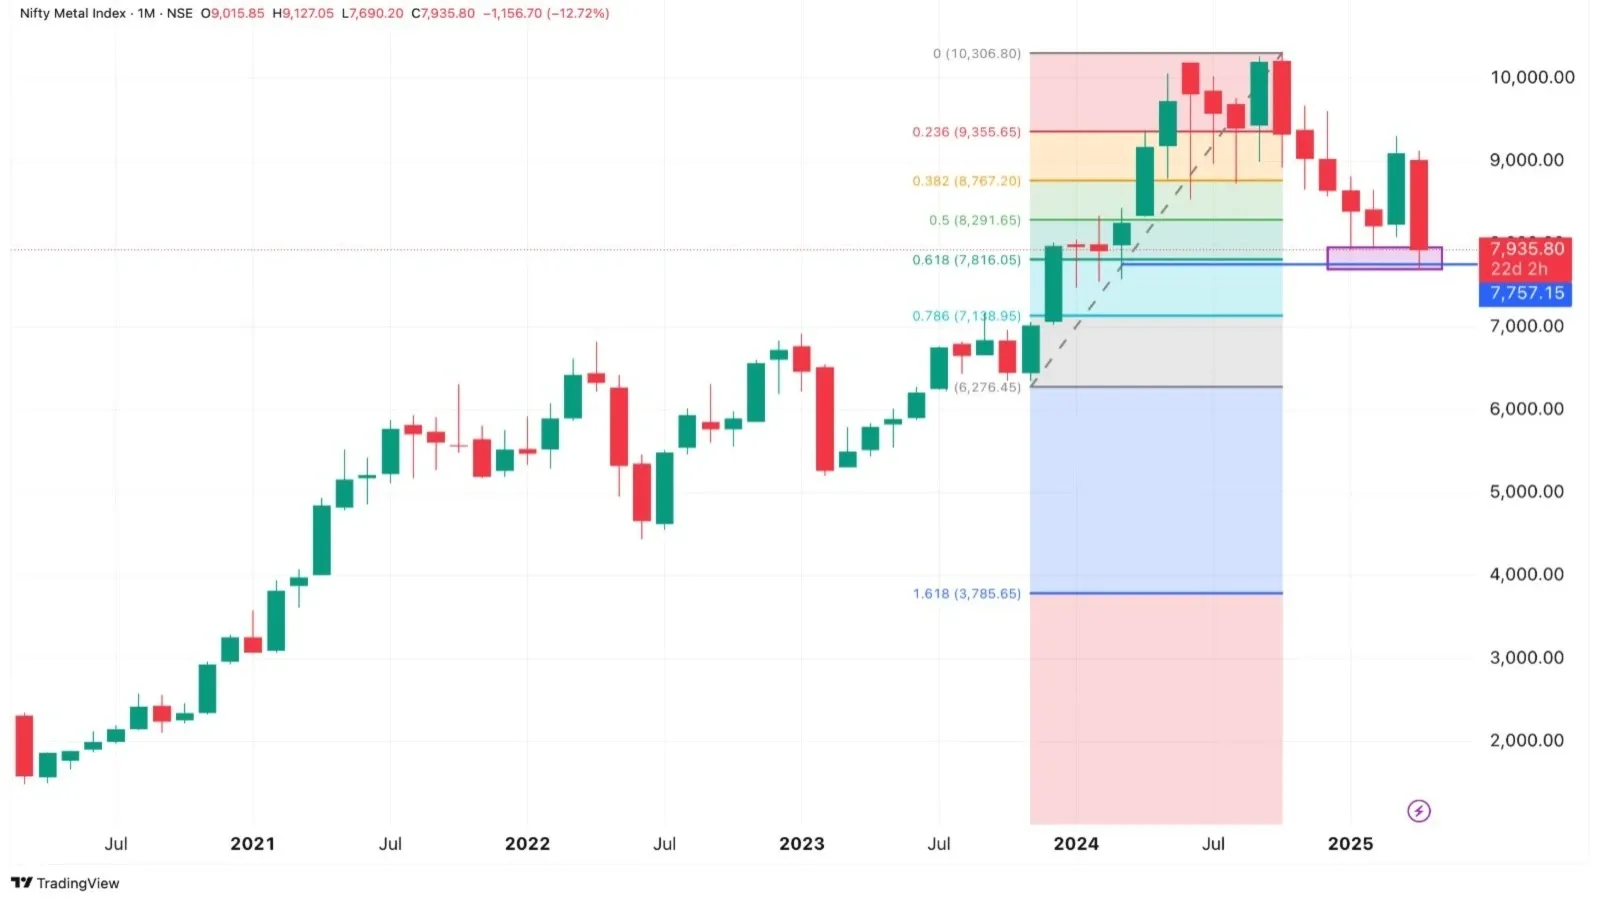
| NIFTY Metal | -2.2 | 10.6 | -14.9 |
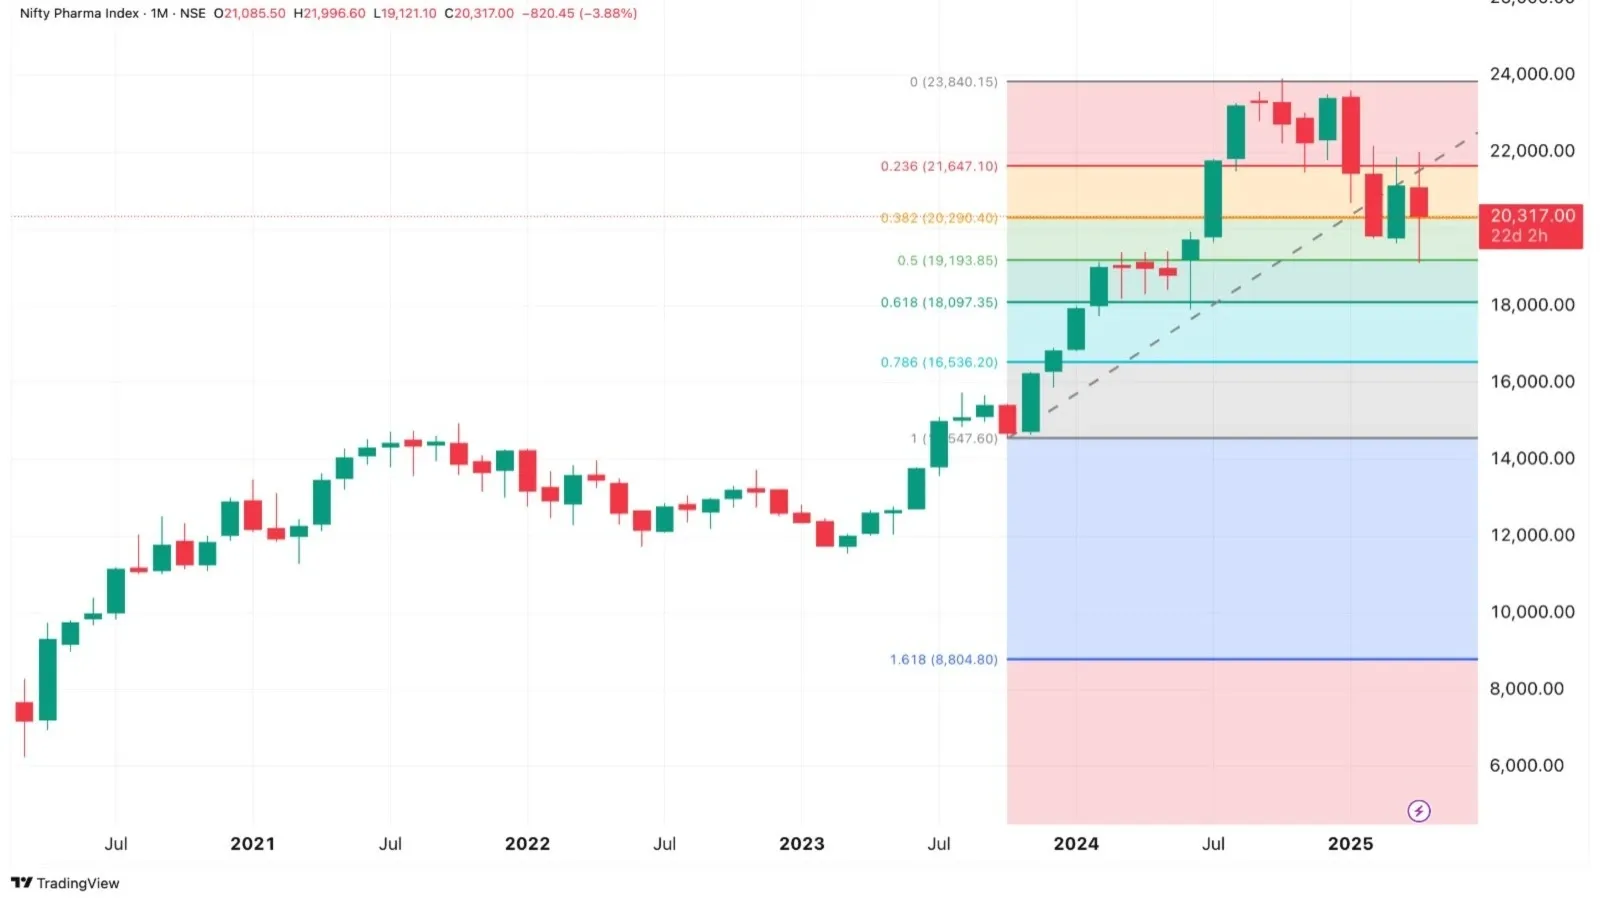
| NIFTY Pharma | -7.6 | 6.7 | -5.6 |
| NIFTY Energy | -11.4 | 11.8 | -7.8 |
Barring, Nifty IT index which has seen a decline for all three months, all other sectoral indices have tried recouping the losses in March 2025 followed by a decline again in April 2025.
Based on these performances and what the monthly price charts are depicting, we have arrived at the potential resistance and support levels for the sectoral indices for the upcoming sessions.
| Index | Support | Resistance |
|---|---|---|
| NIFTY Bank | 47,700-47,800 | 50,700 and 52,700 |
| NIFTY Finserv | 23,000 and 22,500 | 24,650 and 25,200 |
| NIFTY Auto | 19,800 CLS and 18,000 | 22,000 |
| NIFTY IT | 31,300 and 30,700 | 34,550 |
| NIFTY FMCG | 50,600 | 54,000 and 56,300 |
| NIFTY Metal | 7,500 and 7,140 | 8,300 |
| NIFTY Pharma | 19,190 | 21,100 |
| NIFTY Energy | 30,600 and 29,850 | 33,100 |
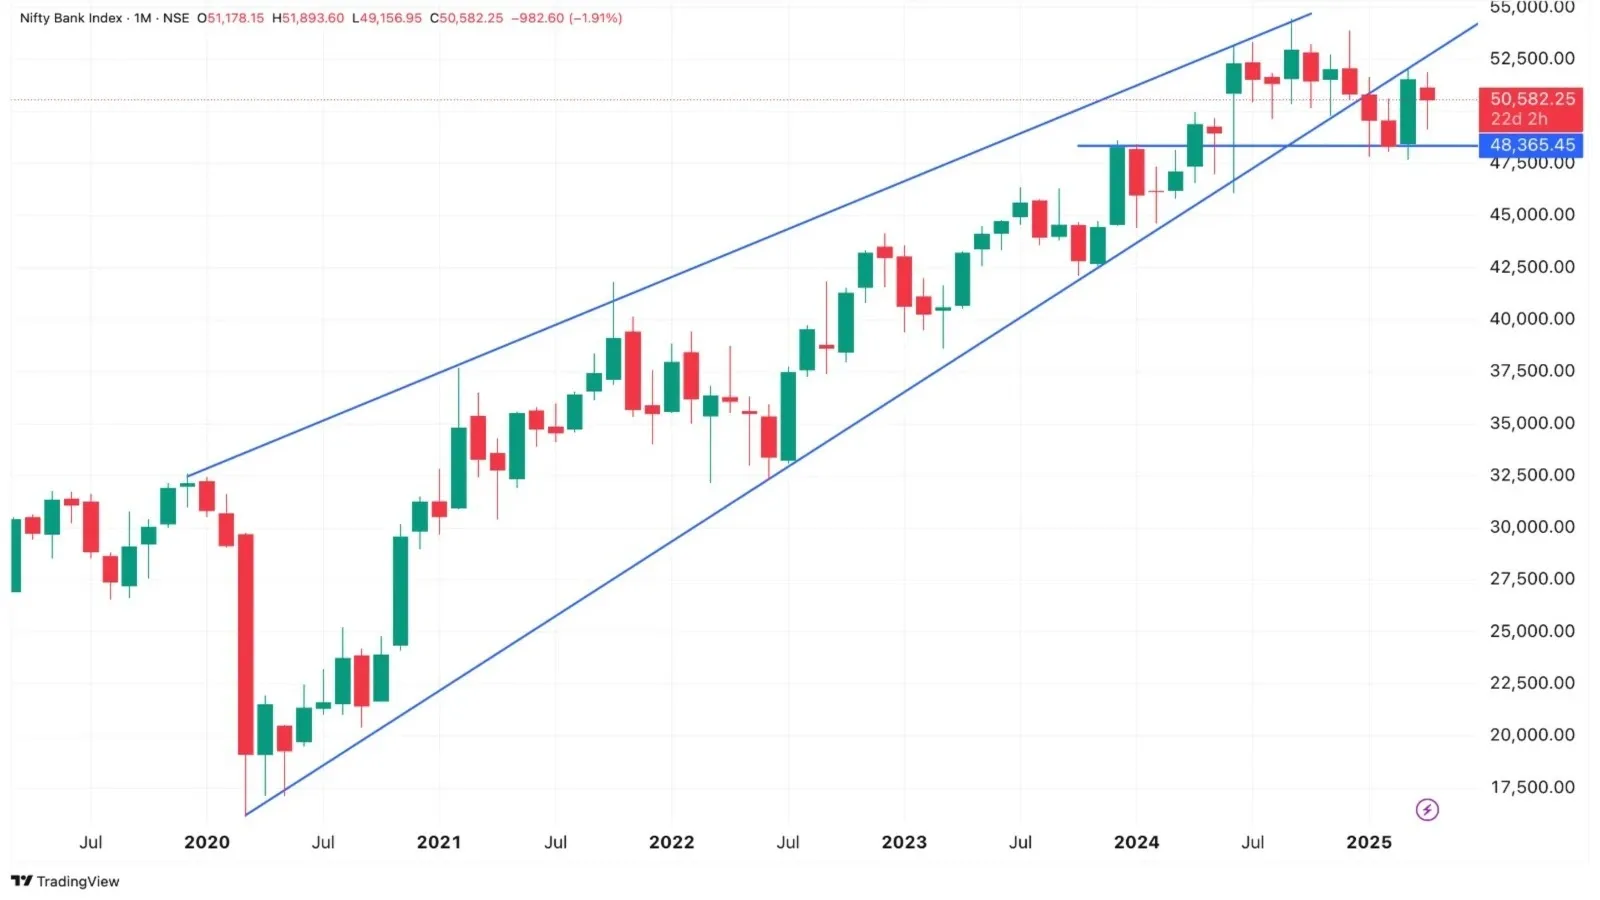
NIFTY Bank
The monthly chart of Nifty Bank presents a slightly different scenario. The index had been trading within an upward channel until a breakdown occurred in January 2025. Since then, it has struggled to regain its position and is still quoting below the channel. A silver lining here is that the index formed a kind of triple bottom in January, February and March near 47,700-47,800, followed by a sharp bounce in March. April prices are hovering above the zone.
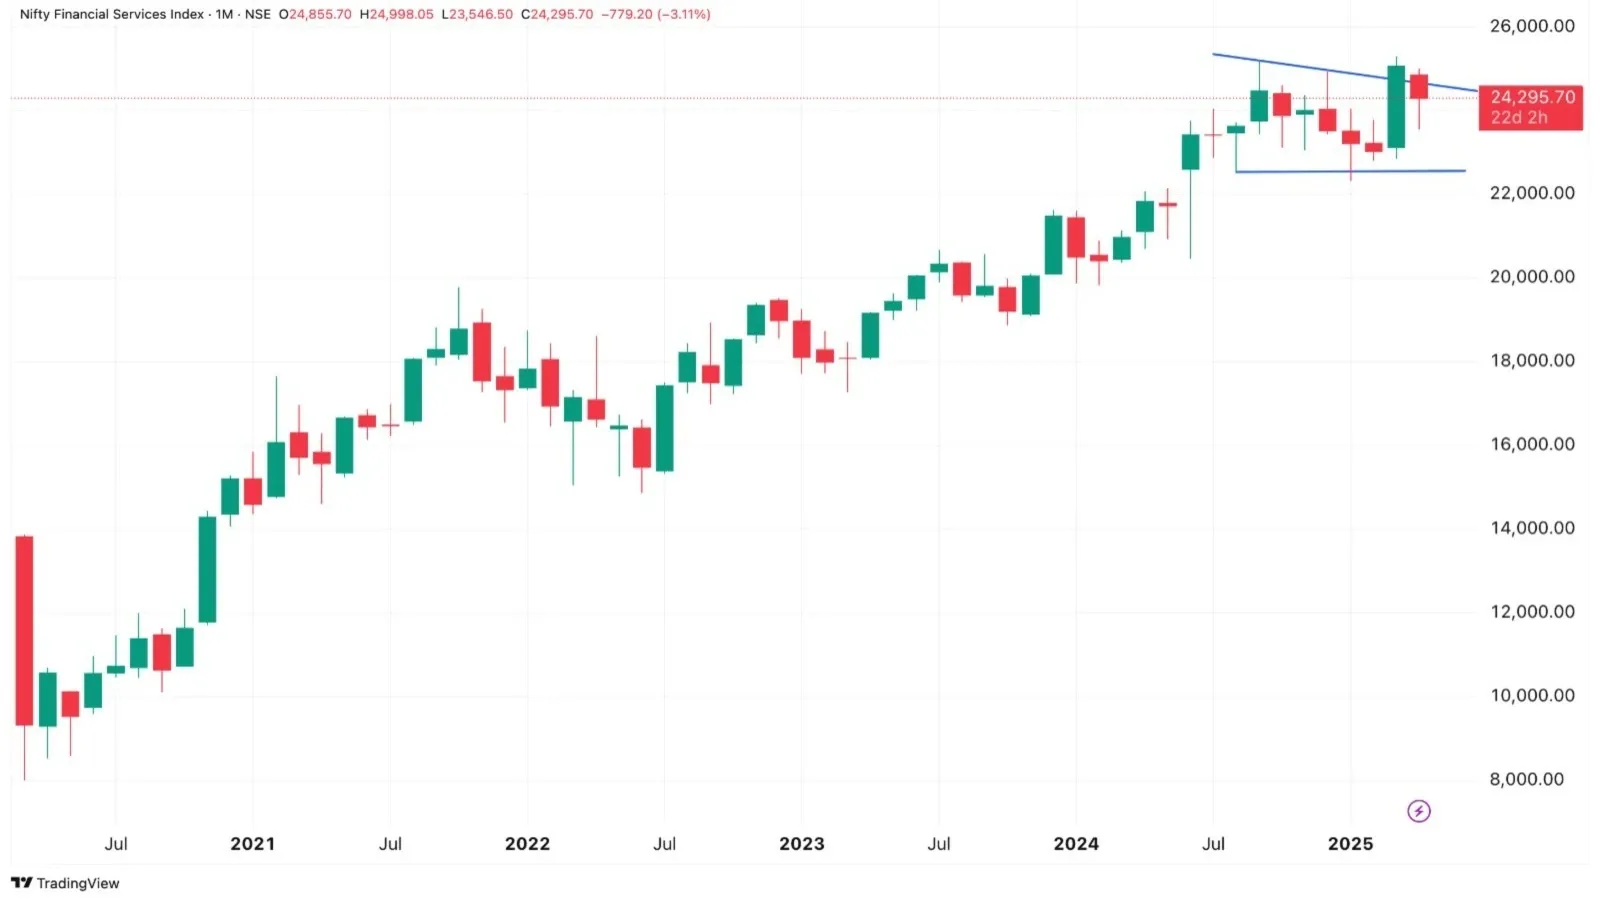
NIFTY Financial Services
Unlike some other sectors, the Financial Services sector has experienced a gradual decline from October to February. However, March saw a remarkable recovery, erasing the five-month downtrend in a single month and reaching a new all-time high. Thus, the current April downturn could be viewed as a pullback i.e., a temporary decline rather than a full collapse.
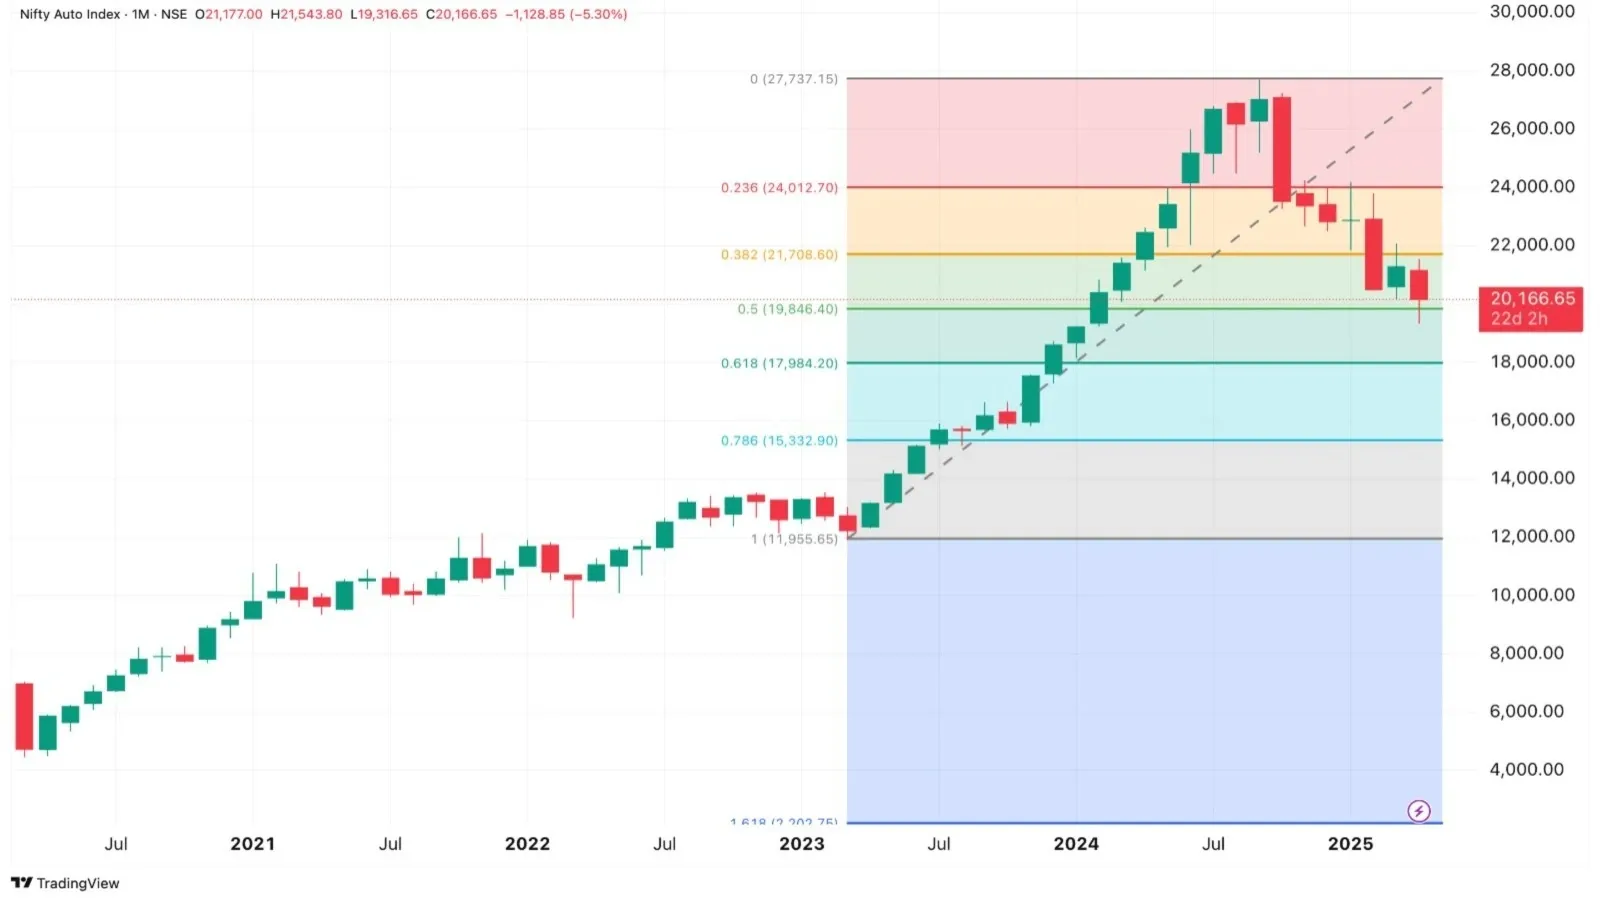
NIFTY Auto
The Auto index witnessed a consistent upward rally from April 2020. However, recently it has been on a steady downward trajectory from October 2024 to the present, declining nearly 50% of the strong upward rally from March 2023 to September 2024. Whether this index reverses from here or continues its decline remains to be seen.
NIFTY IT
Another index faced significant turbulence, with the entire upward movement from June to December 2024 wiped out in the first four months of 2025. It is now trading at June 2024 lows. Time will determine if this level holds as support or breaks down further.
NIFTY FMCG
This index had been forming higher tops and higher bottoms until September 2024. A sharp decline from the September peak reversed this pattern. Recently, it found support near the October 2023 level during February and March 2025, followed by a recovery in March. Currently, it is hovering around the March 2025 recovery levels.
NIFTY Metal
Another index enjoyed a sharp rally from November 2023 to June 2024, followed by consolidation at peak levels until September 2024. A steep decline began in October 2024, erasing 61.8% of the rally from November 2023 to its peak. This 61.8% Fibonacci level is a critical point where prices might reverse if strong support emerges. Let’s watch what unfolds.
NIFTY Pharma
This index rallied from October 2023 to October 2024, hovered at its all time high levels in November and December. A sharp drop of 50% followed in January and February 2025. In March 2025 the index reversed its course and brought some recovery. Could this 50% level serve as support for now?
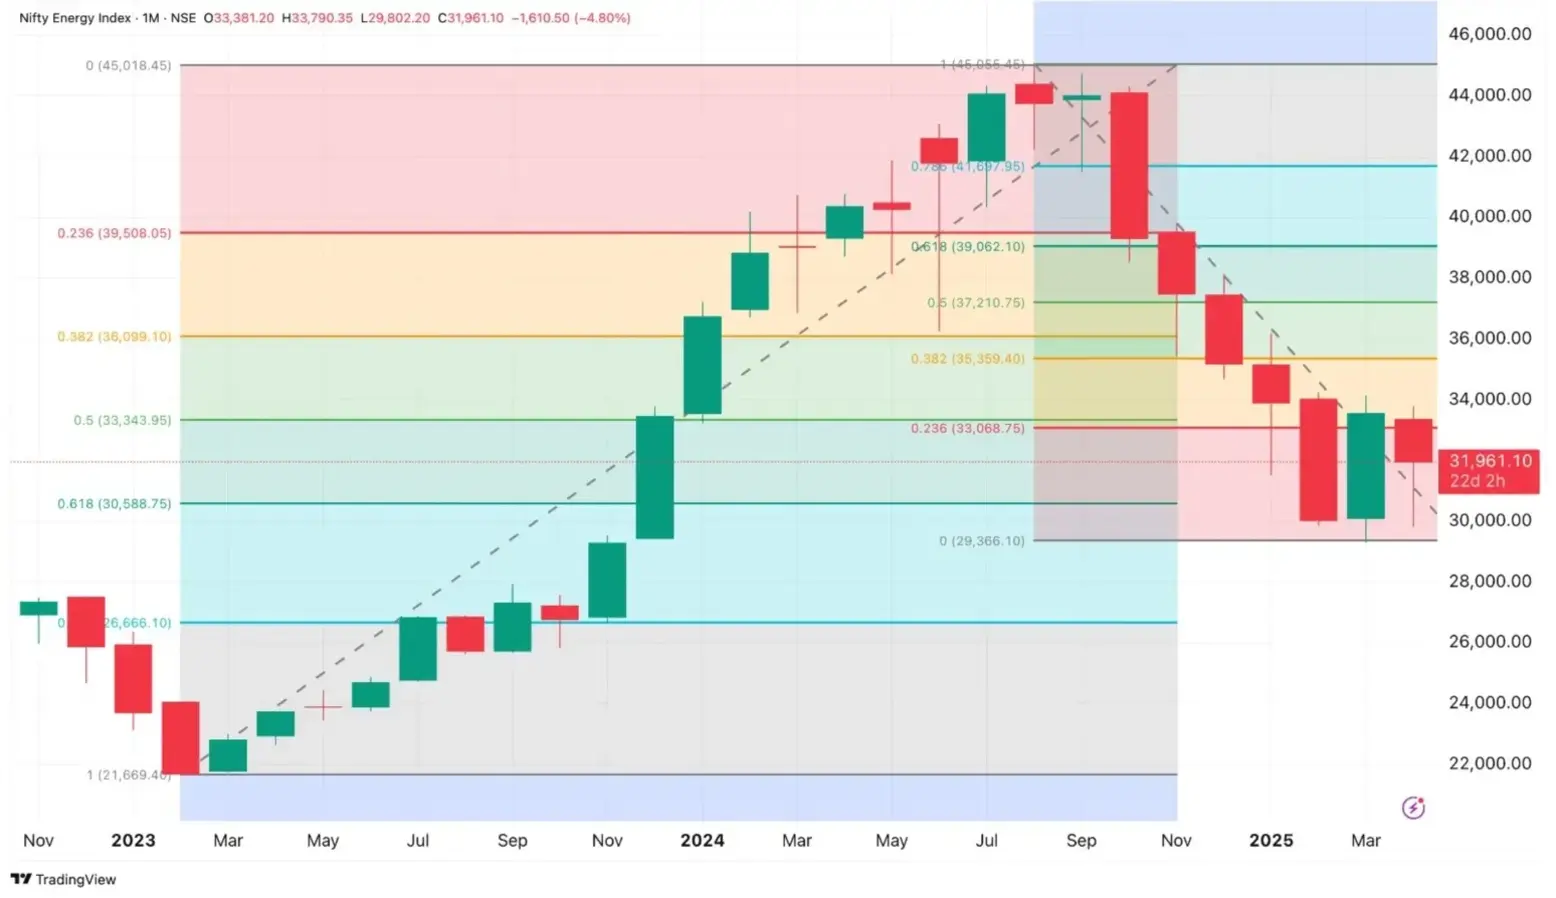
NIFTY Energy
This index saw a steady rally from March 2023 to August 2024, followed by a sharp decline until February 2025, declining nearly 61.8% of the entire move. March 2025 marked a recovery from these levels, but April saw another decline, with the index hopefully finding support near the 61.8% mark. Let’s see if this level holds as support.
The tariff-driven turmoil has left global indices, including India’s, in a state of confusion. Currently, India’s major indices are teetering near key support levels that could either hold steady or give way to sharper declines. The charts reveal cracks but show the indices lingering near past supports, reflecting resilience under pressure. The movement in April and how the month closes will shape the future of the Indian markets.
Other factors influencing near-term trends include RBI policies, Q4 FY2025 company performance reports and inflation data.
About The Author
Next Story


