Upstox Originals
Sensex-to-Gold ratio: What does it tell about valuations?
.png)
6 min read | Updated on May 09, 2025, 12:23 IST


SUMMARY
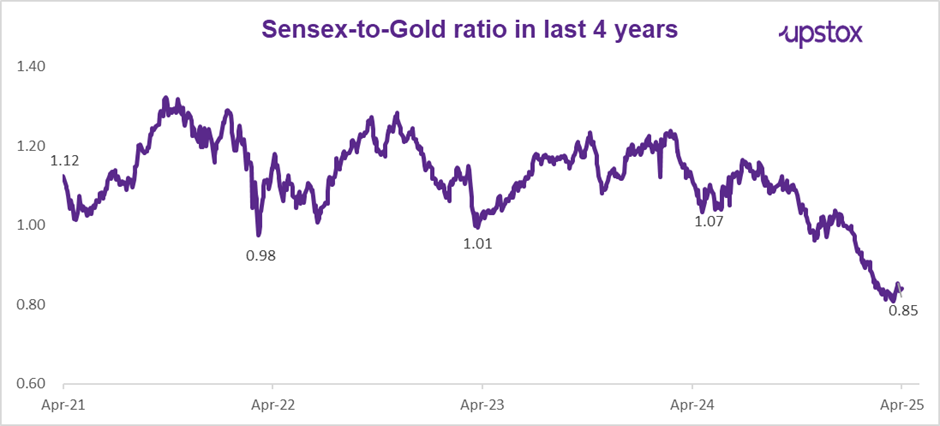
Gold delivered a return of over 40% in FY25, significantly outperforming the Sensex. This divergence has prompted investors to reassess their asset allocation strategies. A key indicator aiding this assessment is the Sensex-to-Gold ratio, which stands at 0.83 as of May 06, 2025. What does it indicate? And what percentage of your portfolio should be allocated to gold?
At current levels, equities could be more attractive compared to gold
Gold is a universally accepted asset that has historically preserved its use case as a store of value over time. It also benefits from diverse sources of demand, such as:
-
Investment demand (ETFs, bars, coins),
-
Central bank reserves,
-
Jewellery consumption and
-
Industrial and technological applications.
Gold has returned over 40% in FY25, while the Sensex has returned just 5% in FY25. This stark contrast has led many investors to question whether gold should now command a larger share of their portfolios. While some are wondering if they should now trim their gold holdings, given the run up in price.
But before making allocation shifts, it’s essential to understand the broader context of how gold and equities interact over time. One insightful way to evaluate this relationship is through the Sensex-to-Gold ratio.
A metric that helps identify patterns and trends in the relationship between equities (represented by the Sensex) and gold. The ratio is used to gauge the relative attractiveness of investments in equities versus gold.
How to calculate the Sensex-to-Gold ratio:
The Sensex-to-Gold ratio is calculated by dividing the Sensex price index value by the price of gold per 10 grams. For example, on April 28, 2025, the Sensex closed at 80,218, and the gold price for 10 grams closed at ₹96,060. So, the Sensex-to-Gold ratio would be 0.835 (80,218/96,060).
Source: Investing.com, NSE
What does the Sensex-to-Gold ratio indicate?
The Sensex-to-Gold ratio serves as a relative valuation tool between equities and gold:
-
A ratio below 1 indicates that equities might be undervalued vis-à-vis gold.
-
A ratio above 1 indicates that gold might be undervalued
This ratio helps investors make strategic allocation decisions based on historical trends and relative asset valuations.
Historical trends
Based on the historical data of 30 years (1995 to 2025), let us understand how the two asset classes performed in the subsequent 3-year period based on different levels of the ratio.
Historical trends of Sensex-to-Gold ratio
| Sensex to Gold Ratio | Gold CAGR* | Gold CAGR* | Gold CAGR* | Sensex CAGR* | Sensex CAGR* | Sensex CAGR* |
|---|---|---|---|---|---|---|
| Average | Minimum | Maximum | Average | Minimum | Maximum | |
| 0.5 - 0.6 | 11.7% | -4.6% | 22.0% | 31.1% | 17.1% | 54.7% |
| 0.6 - 0.7 | 2.4% | -6.8% | 10.4% | 15.8% | 3.6% | 26.0% |
| 0.7 - 0.8 | -0.9% | -0.9% | -0.9% | 6.1% | 6.1% | 6.1% |
| 0.8 - 0.9 | 6.9% | -1.4% | 16.4% | 12.3% | -2.5% | 32.7% |
| 0.9 - 1.0 | 15.7% | 0.6% | 26.1% | 11.3% | -2.5% | 34.1% |
| 1.0 - 1.1 | 14.9% | 5.7% | 27.1% | 8.6% | -0.2% | 14.6% |
| 1.1 - 1.2 | 21.6% | 9.8% | 42.8% | 4.3% | -15.2% | 14.2% |
| 1.2 - 1.3 | 19.8% | 17.8% | 21.6% | 6.7% | -4.9% | 14.8% |
Source: Investing.com, NSE
To calculate the CAGR, we have considered the Sensex to Gold Ratio levels from each financial year end beginning from March 31, 1995. The average, minimum and maximum CAGR levels have been calculated for a 3 year subsequent period.
When the Sensex to gold ratio is below 1: As it can be seen from the table, when the ratio fell in the range of 0.5 - 0.6, the average subsequent 3-year CAGR of the Sensex was 31.1% with a high of 54.7%, while gold returned an average CAGR of 11.7%.
When the Sensex to gold ratio is above 1: Historical data suggests that when the ratio crosses 1, gold's exhibited an average upside, with an average subsequent 3-year CAGR of 21.6% (in the range of 1.1 to 1.2). Although the Sensex exhibited moderate growth of 4.3%.
Intermediate Ratios (0.8 to 1.0): When the ratio is in this range, there tends to be a more balanced performance between two asset classes.
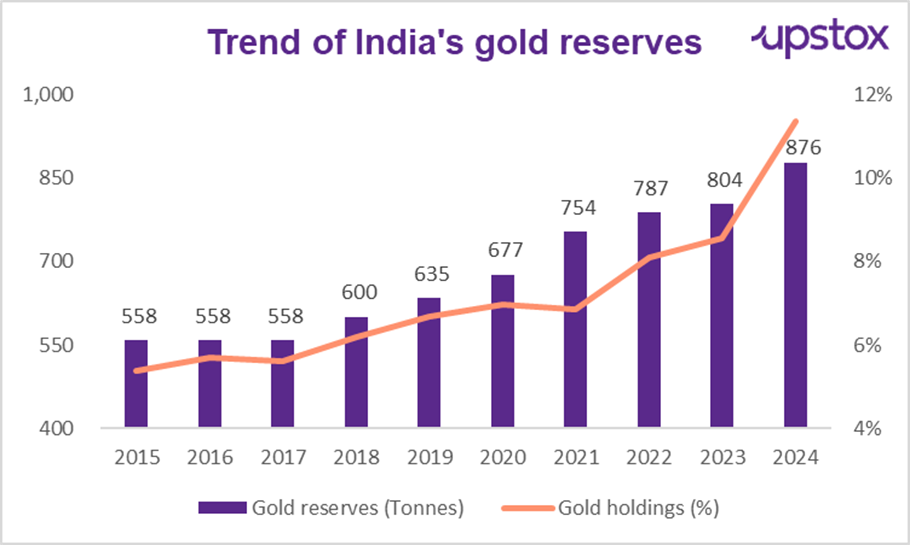
Surge in RBI’s gold reserves
Over the past decade, the RBI has steadily increased its gold holdings. The proportion of gold reserves in total reserves has grown from 5.4% in 2015 to 11.4% in 2024, marking a significant rise, especially in recent years.
Incremental Gold Reserves:
-
2015-2023: Between 2015 and 2023, RBI’s gold reserves increased gradually, with an annual average increase of approximately 30-40 tonnes per year.
-
2024: However, in 2024, the RBI added 72.6 tonnes, highlighting an aggressive shift toward accumulating gold in response to the growing global uncertainties.
Source: International Monetary Fund's International Financial Statistics (IFS)
Whether the shift towards gold signalled a move away from the US dollar as a dominant settlement mechanism?
However, Finance Minister Nirmala Sitharaman clarified that India's rising gold reserves, including those held by the RBI, are not intended to replace any international currency.
What do the RIAs have to say?
When asked about the outlook on gold and the recent surge in Gold prices and if this movement should impact the ideal asset allocation of investors to Gold, this is what the RIAs had to say:
Keval Bhanushali, the Co-Founder & CEO of 1 Finance, said, “For anyone, it is extremely difficult to correctly predict the short-term outcomes every time, and that is why one must not tinker significantly with their ideal asset allocations to various asset classes. Our research at 1 Finance Magazine shows that local currency Gold outperformed all Emerging Market countries' headline indices over the long term.
Yet, our study of 5,261 individuals shows that individuals allocate just 3% to gold while allocating ~20% to equities. Ideal allocation to gold may vary among individuals but that shouldn't be tinkered with.”
“As the US moves into attempted devaluation of its currency and global tensions continue, there is a strong case for gold to continue to move higher over the next few years.
In the short term, however, with the massive upside, the future movement will heavily depend on the magnitude of Trump’s trade wars and hence we recommend that investors continue to hold a 5% holding as a hedge; however, higher tactical allocations can be avoided considering this sharp move in the recent past,” said Vivek Banka, Co-founder at GoalTeller.
Outlook for gold
Given the current Sensex-to-Gold ratio is below 1, it signals that equities (Sensex) are undervalued relative to gold. Historically, this level has often led to stronger equity performance in subsequent 3-year periods.
However, past trends are not guarantees of future outcomes, and actual performance will also depend on several macroeconomic and geopolitical factors, such as:
-
Global economic uncertainty,
-
Interest rate volatility,
-
Weakening of the US dollar and
-
Geopolitical tensions (e.g., Russia-Ukraine war).
About The Author
Next Story


