Market News
Stock market today: NIFTY50, SENSEX break multiple resistances, do they signal a potential ATH break?

3 min read | Updated on May 13, 2025, 09:24 IST


SUMMARY
Benchmark indices, NIFTY50 and SENSEX, surged over 3.5% in a single day, driven by the India-Pakistan ceasefire, a 90-day US-China tariff pause and potential Russia-Ukraine peace talks. Both NIFTY50 and SENSEX indices witnessed breakaway gaps at multiple resistance levels and are now just 5% and 4% from their all-time highs, respectively.

If NIFTY50 closes above 24,858 on a weekly basis, it would indicate the possibility of it heading toward the ATH level, which is about 5% higher.
The NIFTY50 and SENSEX witnessed their best day in the last four years. Both the benchmark indices surged more than 3.5% in a single day.
A triple win for the Indian markets as three conflicts pause:
- The India-Pakistan ceasefire signals easing tensions.
- The US and China agreed on a 90-day pause in their tariff war during recent talks. Moreover, the US has agreed to slash tariffs on Chinese goods from 145% to 30%. China has also agreed to reduce tariffs on US goods to 10%.
- After three years of ongoing war, possible peace talks between Russia and Ukraine are expected soon.
Let’s see what the charts are saying:
NIFTY50
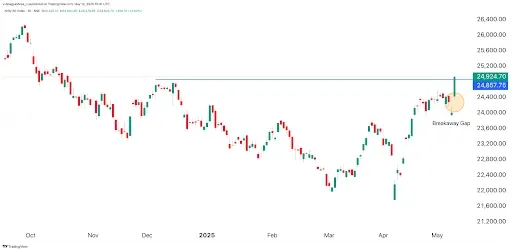
- On the daily time frame, the NIFTY50 witnessed a gap-up opening on May 12, 2025, after two straight days of weakness at the end of the prior week.
- The NIFTY50 has given a breakaway gap. A breakaway gap is a price gap on a chart where the price jumps sharply up or down, leaving a “gap” between the previous day’s closing price and the next day’s opening price, with no trading in between. It typically signals the start of a new trend—either bullish (upward) or bearish (downward).
Source: Tradingview
- The NIFTY50 not only broke its recent resistance at 24,589 formed on May 2 but also surpassed its December resistance at 24,858, achieving a multi-month breakout.
- A long bullish candle indicates that buyers have taken control and the bullish reversal trend is likely to continue.
- On the weekly chart, the NIFTY50 has achieved a V-pattern breakout after a sharp decline from its December high.
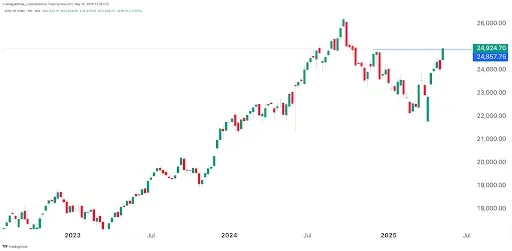
Source: Tradingview
- If NIFTY50 closes above 24,858 on a weekly basis, it would indicate the possibility of it heading toward the ATH level, which is about 5% higher.
SENSEX
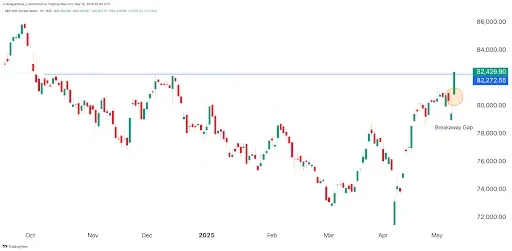
- The SENSEX also achieved a breakaway gap, breaching multiple resistances from October and December 2025 in the 82,220–82,320 range on a closing basis.
- A significant bullish candle further indicates buyer dominance for now.
- The only concern is that the index closed near the resistance, so confirmation over a few sessions is needed for further upside.
- The SENSEX’s all-time high is just 4% away.
Source: Tradingview
Disclaimer:
Investments in the securities market are subject to market risk. Read all the related documents carefully before investing. The stock discussed in this article is only for educational purposes and not a buy or sell recommendation. Investors are advised to conduct their own analysis and risk due diligence before trading and investing in the stock market.
Open FREE Demat Account within minutes!
Join nowAbout The Author
Bhagyashree Vivarekar is a finance professional with over 13 years of experience in technical and fundamental equity research. She holds an MBA in Finance and has developed a deep understanding of financial analysis and market trends.
Next Story


