Market News
NIFTY50 and SENSEX take support at 500 DEMA, RSI in an oversold zone; is a relief rally on the cards?

3 min read | Updated on March 05, 2025, 17:05 IST


SUMMARY
The technical charts of NIFTY50 and SENSEX indicate a pause in current correction and a probable reversal in the markets from current levels. The charts show that NIFTY50 and SENSEX are in the oversold zone and are taking support at the 500 DEMA.

NIFTY50 and SENSEX take support at 500 DEMA, RSI in an oversold zone; is a relief rally on the cards? | Image source: Shutterstock
Indian benchmark indices showed a strong upmove on Wednesday after posting a 10-day losing streak on NIFTY50. Markets have been in a continued correction mode in the last five months, falling more than 14% from record-high levels. The broader market indices like NIFTY Midcap 100 and Smallcap 100 have have fallen more than 25% from recent highs, adding pain to investor sentiments.
However, after a steep correction from a record high, markets now look in an oversold zone on technical parameters and could stabilise at current levels. Here are a few charts that indicate markets are poised for a relief rally.
Majority of the retracement is done
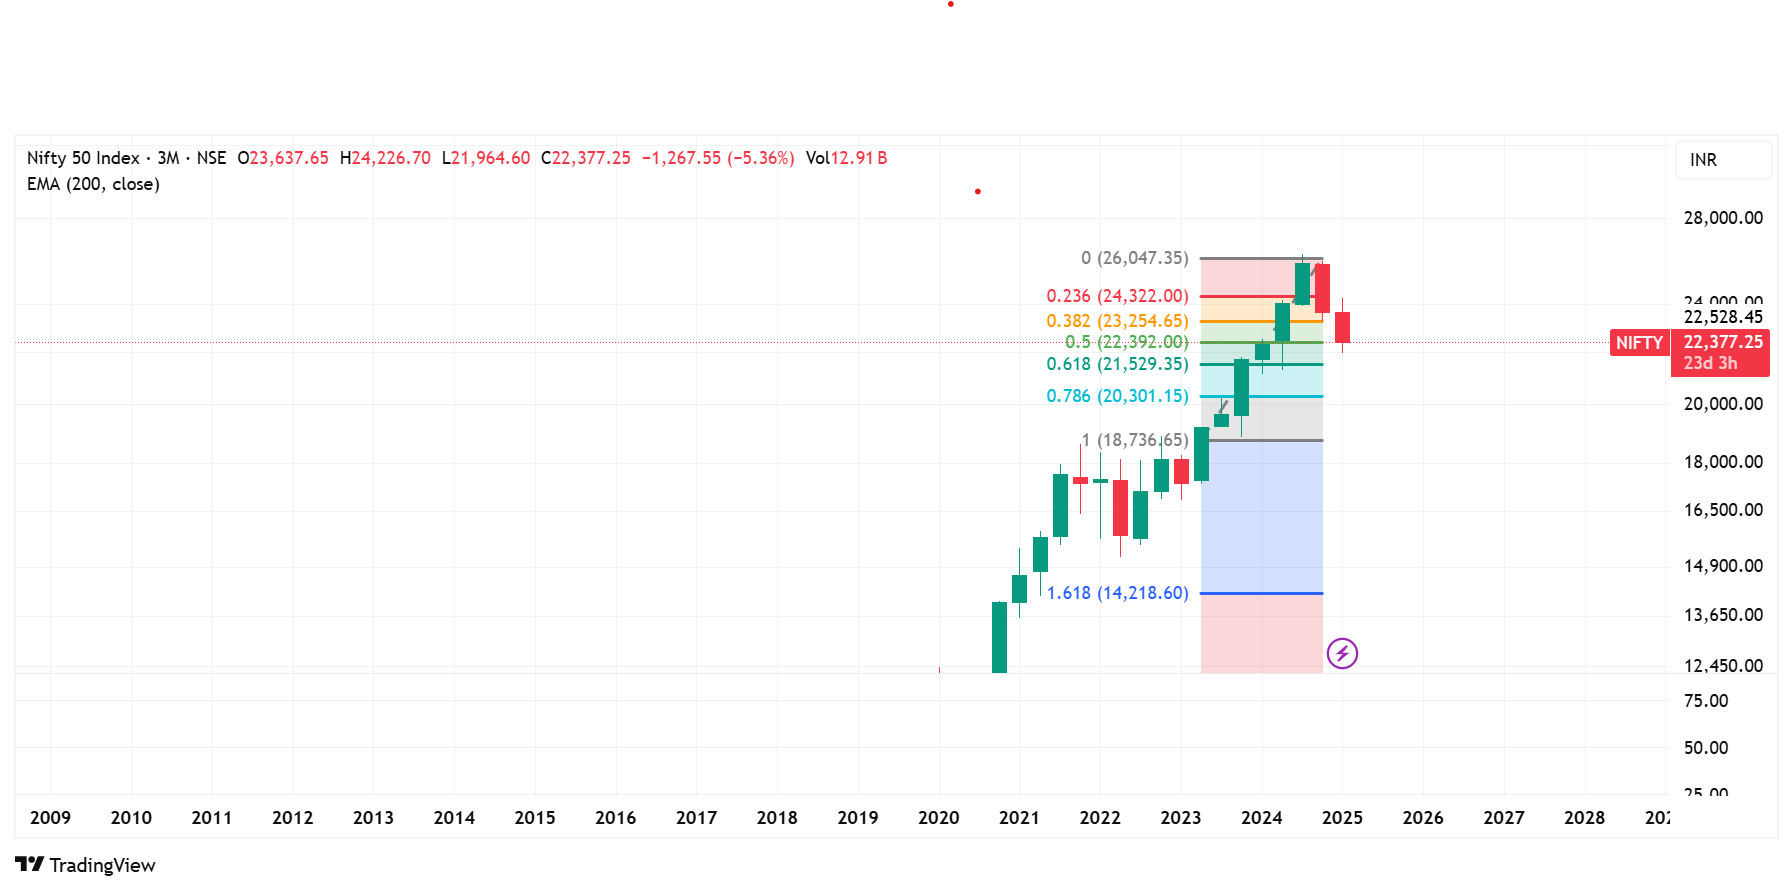 (Source: Upstox.pro, TradingView)
On the 3-month chart, the NIFTY50 is currently hovering at its 50% retracement level. A close above the retracement zone of 22,390, which is a 50% retracement of the rally that started in July 2023, would indicate a pause in the correction and a bullish reversal.
Markets take support at 500 DEMA and RSI in oversold territory
The daily moving exponential average shows how markets behave over a long period of time by smoothing the volatile movements and plotting them on one line. Indian markets have taken support at 500 DEMA levels, indicating crucial support at these levels.
Secondly, the index RSI (Relative Strength Index) shows bottoming out from the oversold territory and giving a positive crossover at lower levels. The RSI shows strength in the market for a given period of time. A reading below 30 is considered an oversold zone, and a reading above 70 is an overbought zone. Basically, an oversold zone also indicates extreme bearish sentiment, and a reading above 70 indicates excessive bullishness.
Here’s what the daily charts of NIFTY50 and SENSEX indicate.
NIFTY50

(Source: Upstox.pro, TradingView)
The NIFTY50 daily chart shows two important signals of pause in correction for the near term. First, the NIFTY50 daily chart shows the index reversing from the crucial 500 DEMA level of 21,918. The NIFTY50 made a low of 21,964 on Tuesday, indicating strong support at these levels. A probable reversal in the markets could extend towards 22,800 levels, which was the previous support zone.
SENSEX
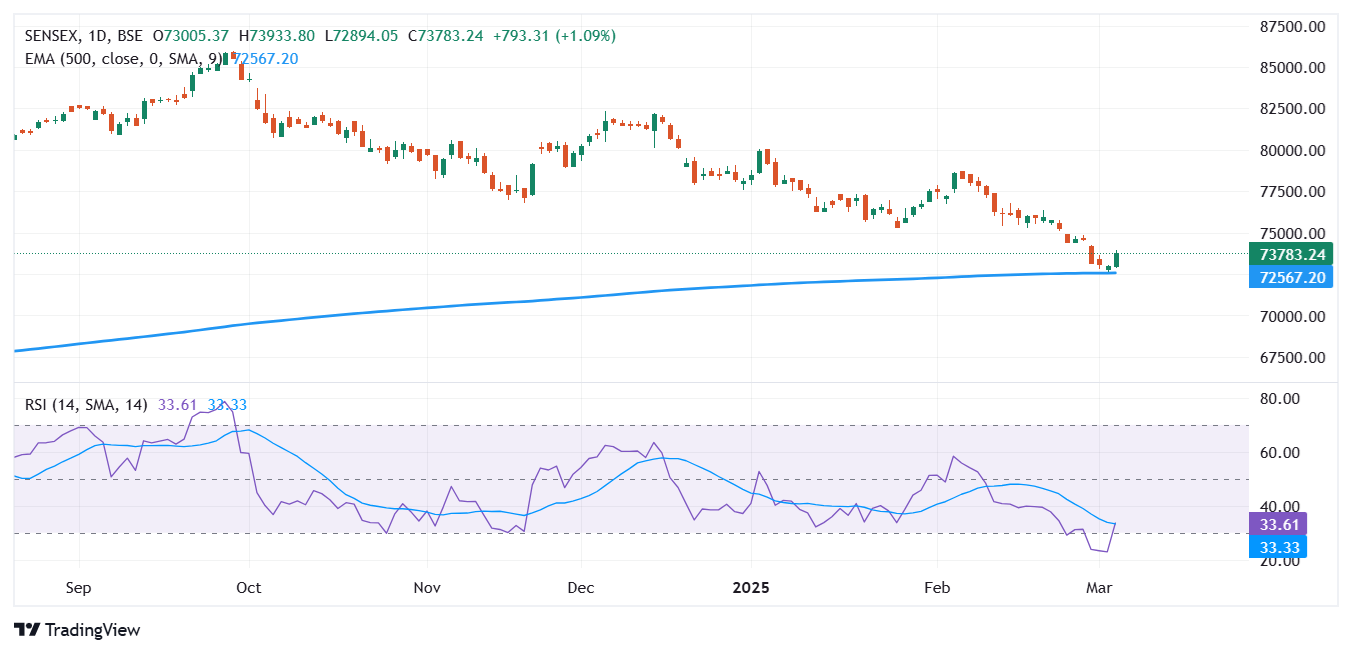
(Source: Upstox.pro, Tradingview)
Similarly, the SENSEX has taken support from its 500 DEMA levels of 72,567, and the RSI has shown a reversal from the 21 level, indicating a potential relief rally in the index. The rally could extend towards previous support levels of 75,500, which is the new resistance level.
While the charts indicate a much-needed relief rally, markets can surprise investors on either side due to unexpected news that could rattle investor sentiments.

About The Author
Next Story