Market News
TCS Q4 results: Check earnings preview and technical structure ahead of Q4FY25 results
.png)
3 min read | Updated on April 09, 2025, 09:52 IST
SUMMARY
Ahead of its fourth-quarter earnings, TCS shares formed a Doji candlestick on the daily chart — a sign of market indecision. This makes the candle’s high and low key levels to watch in the near term. Meanwhile, the options market is pricing in a ±5.7% move ahead of the April 24th expiry.
Stock list

TCS could see ±5.7% move as per options market pricing structure till April 24th. | Image: Shutterstock
TCS is likely to report a 1% to 1.5% quarter-on-quarter drop in revenue for the March quarter. Revenue is expected to range between ₹63,050 crore and ₹64,850 crore. The decline may be due to flat or sluggish growth in both domestic and international markets, along with muted new deal wins.
Despite the marginal revenue dip, TCS is expected to post a 2% to 3% sequential rise in net profit, likely between ₹12,480 crore and ₹12,650 crore. Meanwhile, the EBIT margin is expected to improve by 40 to 50 basis points, likely staying between 24.3% and 25%.
Investors will closely watch new deal wins and management’s commentary on U.S. tariffs and the overall growth outlook amid the global trade war and ongoing economic uncertainty.
Ahead of the Q4 results, TCS shares are trading 1.5% lower at ₹3,241 per share on Wednesday, April 9. Year-to-date, TCS shares are down over 20%, in line with other IT stocks, as the sector struggles with U.S. recession fears following recent tariff hikes.
Technical View
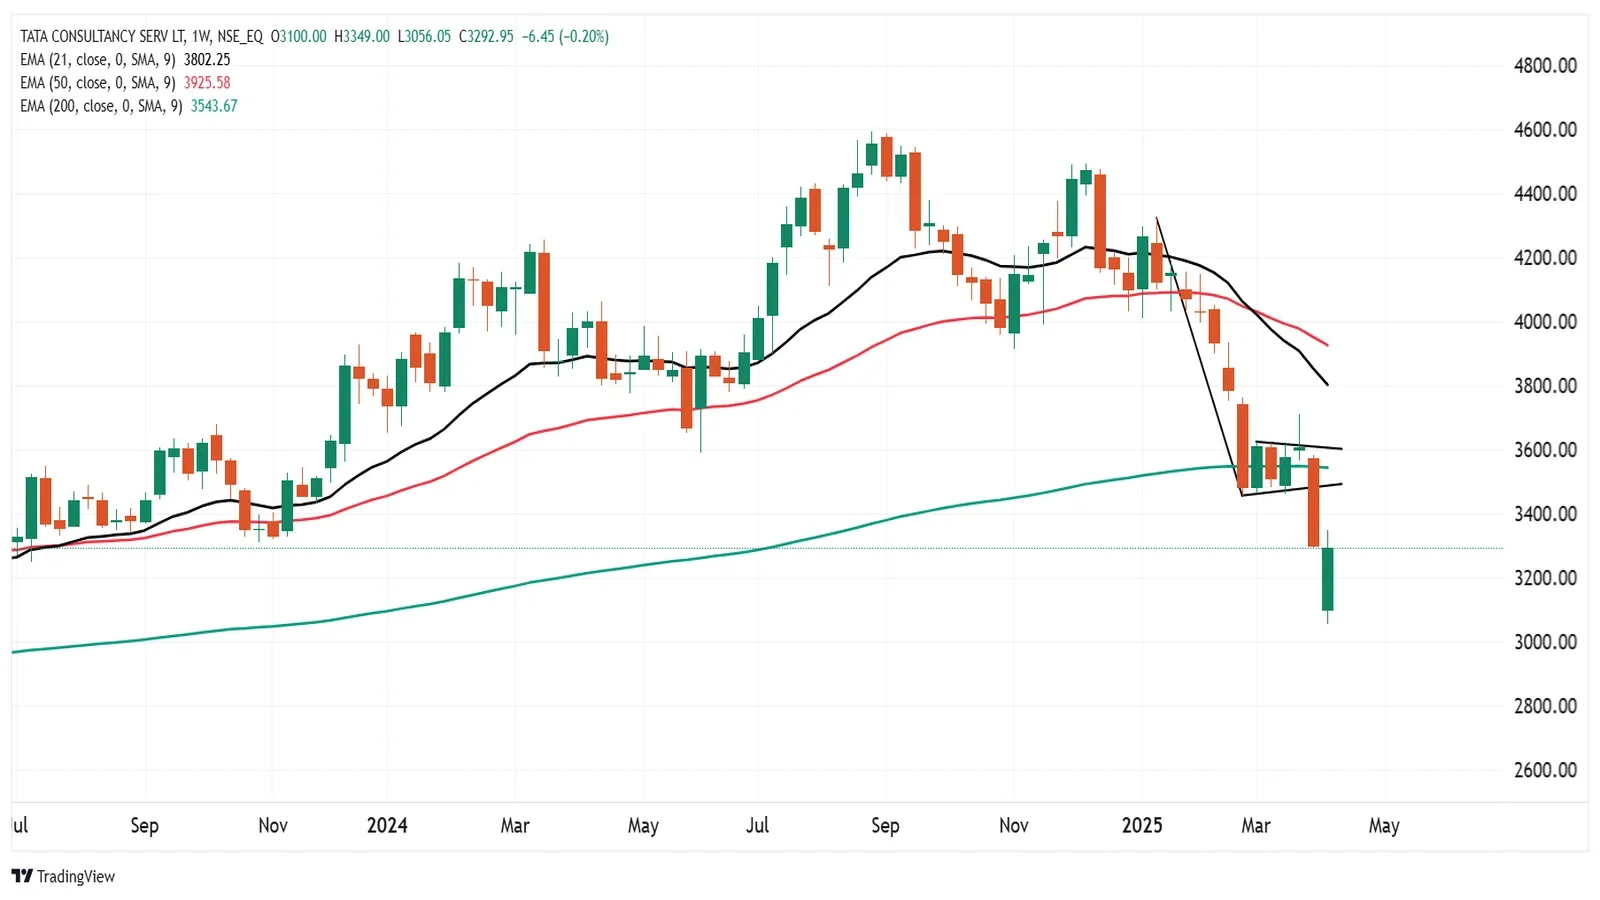
TCS’s broader technical setup appears weak on both daily and weekly charts, having corrected over 26% from its December 2024 high. On the weekly chart, the stock is trading below its 21, 50, and 200-week exponential moving averages — a clear sign of continued weakness. It has also broken below the key support zone at ₹3,450, accompanied by a breakdown from a bearish flag pattern.

Options outlook
For the April 24th expiry, open interest data shows heavy call writing at the 3,700 and 3,600 strikes, pointing to likely resistance in that range. Additionally, the call additions were also seen at 3,300 and 3,320 strikes.On the flip side, put build-up was seen at 3,200 and 3,000 strikes, with low volume.
At the 3,300 strike - currently at-the-money for TCS - both call and put options are priced at ₹188, implying an expected move of around ±5.7%. To gauge whether that's realistic, it's worth looking at how TCS has moved around earnings announcements in the past.

Options strategy for TCS
With the options market pricing in a ±5.7% move for the TCS until April 24th, traders have the opportunity to take advantage of the expected volatility. Depending on your view, you can position yourself with a long straddle or short straddle strategy.
Long Straddle:
It involves buying an at-the-money (ATM) call and put option with the same strike and expiry. This strategy benefits if the stock moves more than ±5.7% in either direction.
Short straddle:
This strategy involves selling both a call and a put with the same strike and expiry. This approach profits if the stock stays within the ±5.7% range, as time decay and lower volatility works in your favour.
Disclaimer
Derivatives trading must be done only by traders who fully understand the risks associated with them and strictly apply risk mechanisms like stop-losses. The information is only for educational purposes. We do not recommend any particular stock, securities and strategies for trading. The stock names mentioned in this article are purely for showing how to do analysis. Take your own decision before investing.
About The Author
Next Story

