Market News
SBI Q4 results today: Check earnings preview, dividend and key technical levels
.png)
4 min read | Updated on May 03, 2025, 08:43 IST


SUMMARY
SBI Q4 results preview: State Bank of India formed a doji candlestick pattern last week and is currently trading near the previous low. The bearish pattern will be confirmed if the current candle closes below the gravestone doji.
Stock list
For the short-term clues, traders can monitor the immediate resistance of ₹835 and the support of ₹768.
According to experts, SBI’s standalone net profit could fall 12-15% YoY to ₹17,200 to ₹18,100 crore, compared to a net profit of ₹20,698 crore in Q4FY24, mainly due to a fall in margins and treasury income. However, net profit could remain flat sequentially. SBI reported a net profit of ₹16,891 crore in the December quarter.
Net interest income (NII) is expected to increase by 4-7% YoY to ₹42,950 to ₹43,900 crore. However, net interest margin (NIM) is likely to decline by 30 to 40 basis points to 2.5% because of an increase in the cost of funds and the recent repo rate cut by the RBI. Despite mixed earnings, SBI could report healthy double-digit growth in loan books and deposits.
During the quarterly result announcement, investors will track management commentary on credit growth within the industry and impact of repo rate cut on overall business. Key performance metrics, including loan and deposit growth, gross and net non-performing assets (NPAs) will also be watched closely. Investors will also look forward to final dividend announcement.
Ahead of the Q4 result announcement, SBI shares are trading 1% higher at ₹797 per share on Friday, May 2. So far this year, SBI shares are down marginally by 0.7%.
Technical view
The technical structure of the SBI remains in a downward slopping channel since 2024 and is forming a lower high and lower low structure on the weekly chart. It formed a gravestone doji last week and is currently trading near the previous week’s low.
For the short-term clues, traders can monitor the immediate resistance of ₹835 and the support of ₹768 which coincides with its 50 weekly exponential moving average. A break above or below this range on a closing basis will provide further directional clues.
.webp)
Options outlook
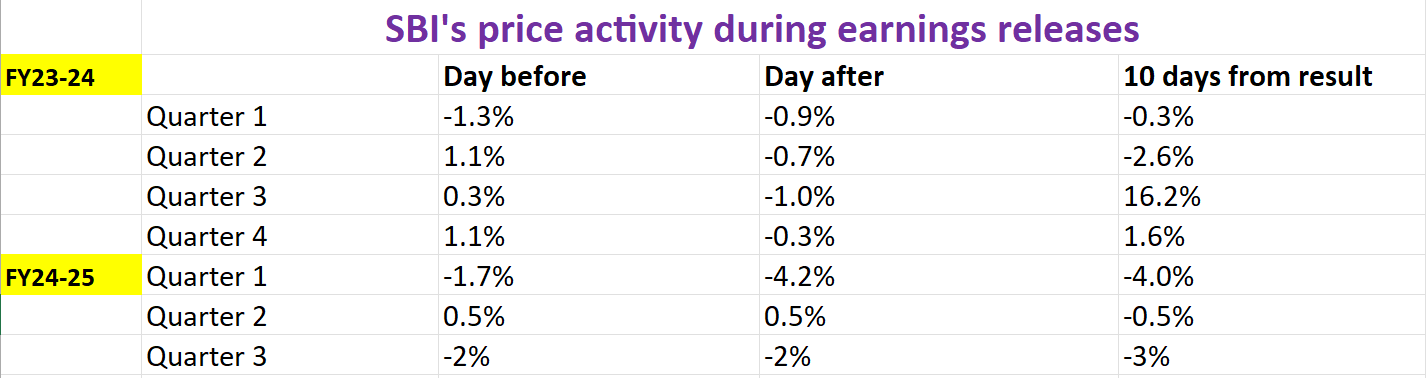
For further understanding, let’s take a look at the historical price behaviour of SBI around its earnings announcement.
Options strategy for State Bank of India
The options data for SBI's May 29th expiry shows a potential price movement of ±7.4%, providing strategic opportunities for traders based on their volatility expectations.
-
Expectation of increased volatility: Traders who expect that the volatility in SBI may rise can consider a Long Straddle strategy. This involves buying both an ATM call and an ATM put option with the same strike price and expiry date. This approach will benefit if the price of SBI moves significantly beyond the range of ±7.4% in either direction.
-
Expectation of lower volatility: Traders who expect volatility will remain low, a Short Straddle may be more suitable. This strategy involves selling both an ATM call and an ATM put option with the same strike price and expiry, and profiting if the price of SBI stays within ±7.4%.
Traders anticipating a break below 200-day EMA on a closing basis or a break above the immediate resistance of ₹835 can consider directional spreads.
-
For a bullish outlook, traders can consider a bull call spread. This strategy involves buying a call option and simultaneously selling another call option with a higher strike price of the same expiry. This approach lowers the initial cost but also limits potential profits.
-
On the other hand, traders expecting a drop in price can initiate a bear put spread. It involves buying a put option while selling a lower strike put, creating a strategy that balances risk and reward.

About The Author
Next Story