Market News
Asian Paints Q4 results: Revenue and net profit likely to fall; check earnings preview and key technical levels
.png)
4 min read | Updated on May 07, 2025, 11:26 IST


SUMMARY
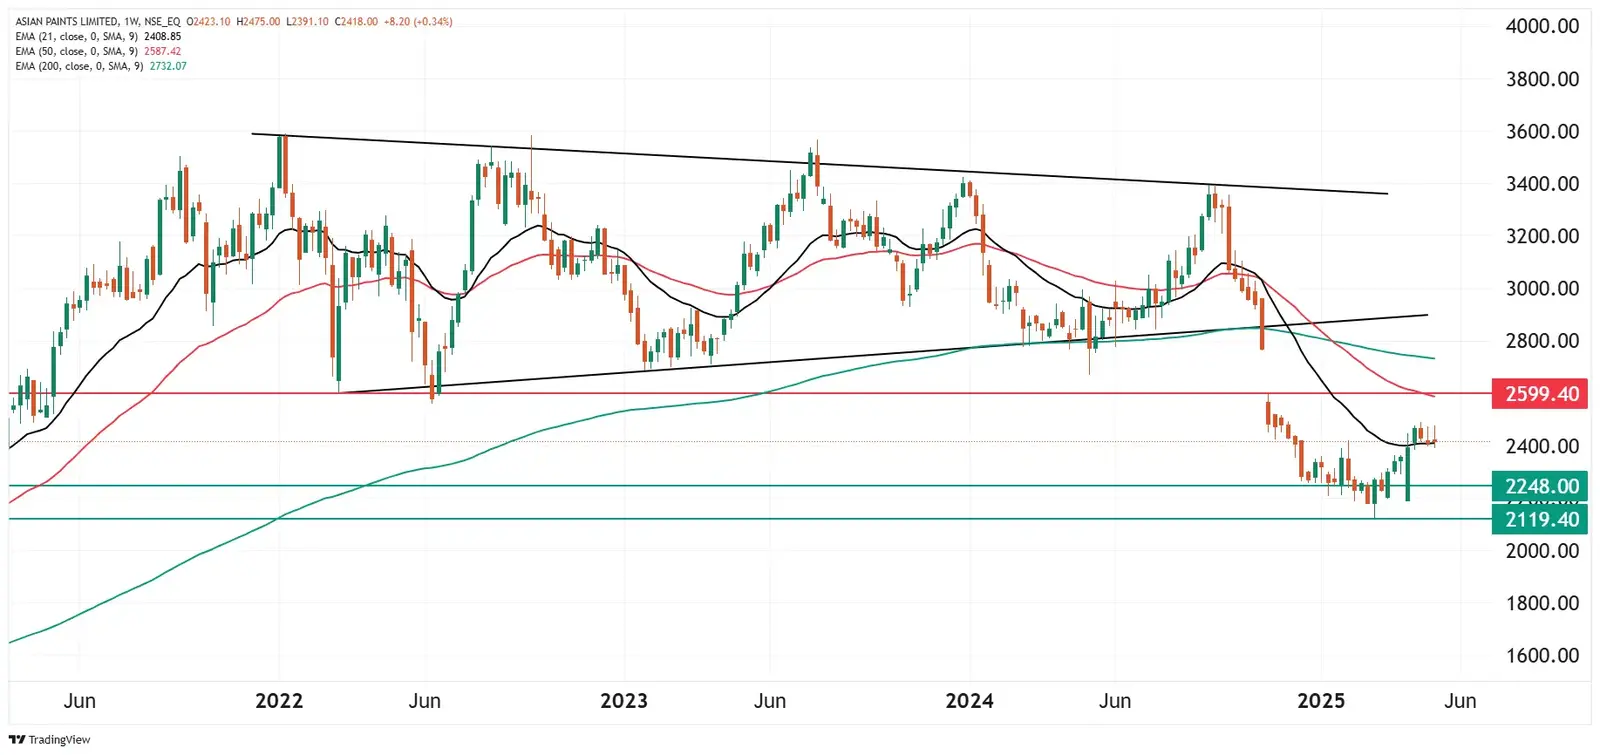
Asian Paints shares face resistance around the ₹2,500 zone post the breakdown of symmetrical pattern in November 2024. The crucial support for the stock remains at 2,100. Within this range, the stock may remain range-bound and a break above or below this zone will provide further directional clues.
Stock list

Asian Paints technical structure remains weak as it trades below the crucial 50 and 200 weekly exponential moving averages (EMAs).
India’s largest paint maker, Asian Paints, will announce its March quarter results on May 8, 2025. The company is likely to report subdued Q4 earnings, with decline in both revenue and net profit.
Experts believe that Asian Paints may report a 1-4% year-on-year (YoY) fall in consolidated revenue to ₹8,630 to ₹8,500 crore. Net profit is projected to fall by 13-17% YoY, estimated between ₹1,050 to ₹1,100 crore. The fall in revenue and net profit are primarily attributed to lower sales volumes, a slowdown in urban consumption, and higher competition in paint sector.
In Q4 FY24, Asian Paints reported consolidated revenue of ₹8,731 crore, compared to ₹8,549 crore in the preceding quarter. The net profit stood at ₹1,275 crore in Q4 FY24, down from ₹1,128 crore in the previous quarter.
Investors will closely monitor management commentary during the results, focusing on the outlook for urban demand, competitive pressures within the industry and the impact of raw material costs on margins. Key performance indicators such as volume growth will also be scrutinised, particularly following Asian Paints' recent price cuts in certain segments. Investors will also look for final dividend announcement by the company.
Ahead of the Q4 result announcement, Asian Paints shares are trading 1.5% lower at ₹2,380 per share on Wednesday, May 7. So far this year, Asian Paints shares have delivered nearly 6% return to investors.
Technical view
The technical structure of the Asian Paints remains weak as it trades below the crucial 50 and 200 weekly exponential moving averages (EMAs). Additionally, the stock brokedown from its symmetrical triangle pattern in November 2024 and is trading below the crucial resistance of ₹2,599.
In the upcoming sessions, traders can monitor the price action between ₹2,599 and ₹2,100. WIthin this range, the stock may remain range-bound. A break of this range on a closing basis will provide further directional clues.
Options outlook
The options data for 29 May expiry has significant call open interest (OI) base at 2,500 strike, indicating resistance for the stock around this level.
Options strategy for Asian Paints
Given the implied move of ±6.1% from the options data, traders can initiate either a long or short volatility trade, taking into account the price movement. To trade based on volatility, a trader can take a Long or Short Straddle route.
Meanwhile, traders seeking a more strategic approach to bullish or bearish options trading can explore directional spreads. On the daily chart, the stock is currently trading between its 200-day and 50-day EMAs. For short-term clues, traders can monitor a close above 200-day or below 50-day EMAs.

About The Author
Next Story